You see odds of 2.10 on the home win. What chance is the bookmaker telling you that has? It gives you a price, and from the price you can work out the probability it contains. This is not the true probability. It is the probability the price implies. It is called implied probability.
The formula
With decimal odds there is one formula:
Implied probability = 1 ÷ odds
As the Wikipedia article on odds puts it, fair odds are the inverse of the probability: odds of 5.00 mean 20%. The Pinnacle guide does the same: 1 divided by the odds, times 100.
| Odds | Calculation | Implied probability |
|---|---|---|
| 1.50 | 1 ÷ 1.50 | 66.7% |
| 2.00 | 1 ÷ 2.00 | 50.0% |
| 3.00 | 1 ÷ 3.00 | 33.3% |
| 4.00 | 1 ÷ 4.00 | 25.0% |
| 10.00 | 1 ÷ 10.00 | 10.0% |
The higher the odds, the lower the probability they contain.

An example you will see often: at 1.90 the probability is 1 ÷ 1.90 = 52.6%. You need roughly 53 wins in 100 not to lose in the long run.

Why the total comes out above 100%
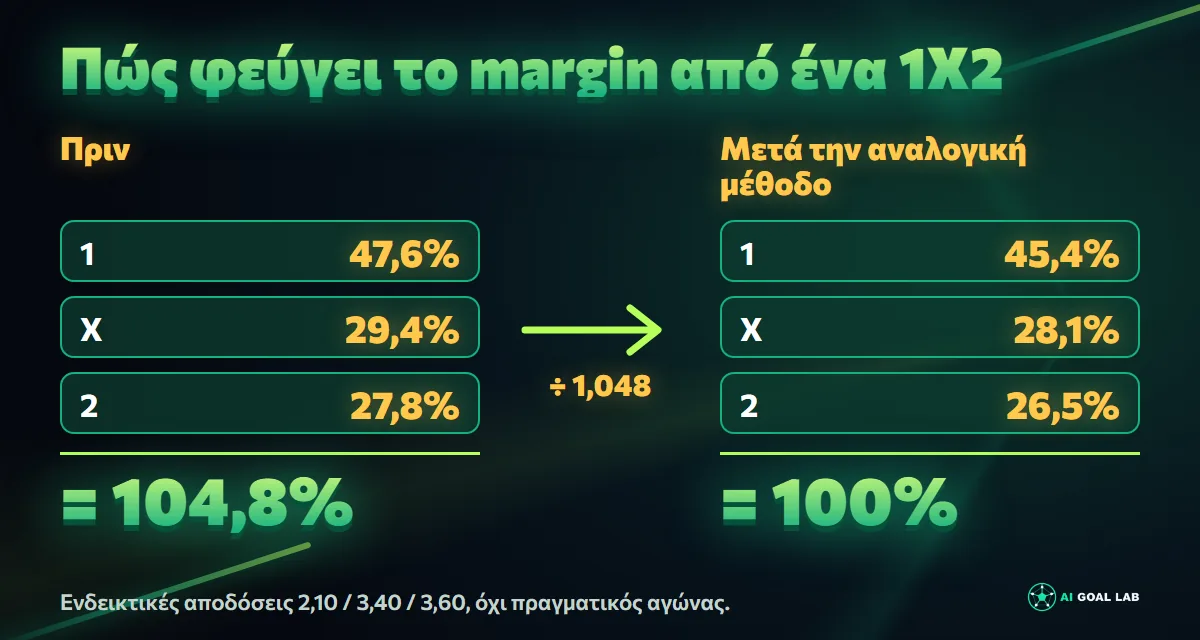
Try the same on a full 1X2 market. We take three illustrative prices. This is not a real match.
| Outcome | Odds | Implied probability |
|---|---|---|
| 1 | 2.10 | 47.6% |
| X | 3.40 | 29.4% |
| 2 | 3.60 | 27.8% |
| Total | 104.8% |
Three probabilities cannot add up to more than 100%. The 4.8% is the bookmaker’s margin (overround), their commission built into the prices. Wikipedia puts it this way: the probabilities of all outcomes add up to more than 100% and the excess is called the overround. In its article on margins Pinnacle gives a football example with a total of 102.3%, a margin of 2.3%.
If you bet at these prices, you pay that margin. That is why the implied probability you see on the board is not quite the market’s “opinion”. It is the opinion plus the commission.
How to remove the margin
Two methods:
One email a week
The numbers of the week, a Bet Maker idea and what is new. Unsubscribe anytime.
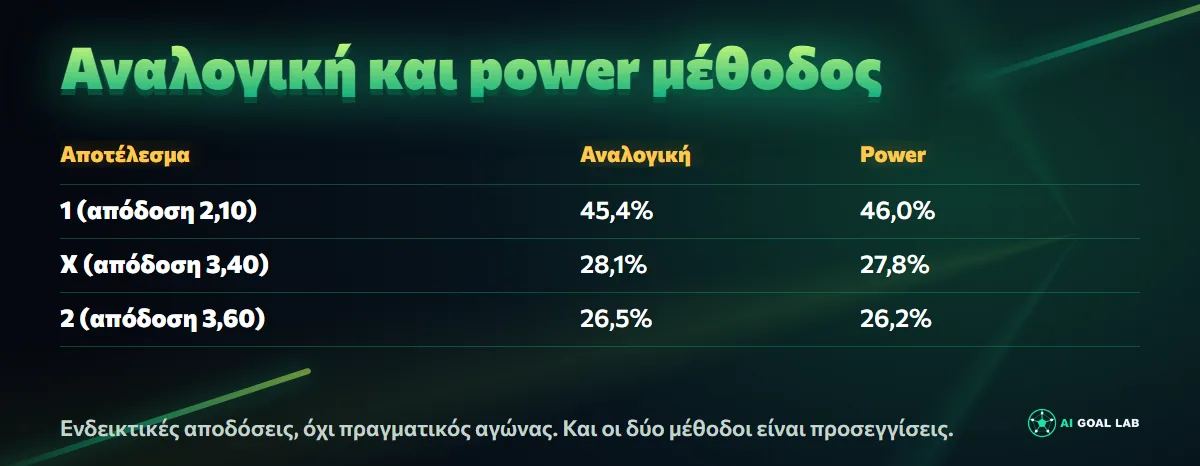
- Proportional (basic normalisation). Divide each probability by the total. It is the most common. In our example: 47.6 ÷ 104.8 = 45.4%, 29.4 ÷ 104.8 = 28.1%, 27.8 ÷ 104.8 = 26.5%. The fair odds come out at 2.20, 3.56 and 3.77.
- Power method. Raise each probability to an exponent k, chosen so that the total becomes 100%. It removes more margin from the big outsiders. With the same numbers it gives 46.0%, 27.8% and 26.2%.
The difference is small for the favourite and larger for the outsider. Both are approximations. Štrumbelj’s 2014 paper on football matches found that Shin’s method gave better results than the proportional one, according to later papers that discuss it. We did not read the original and rely on secondary sources. The same papers say the proportional method is the most common.
In a two-outcome market, such as Over/Under 2.5 with odds of 1.90 and 1.90, the probabilities are 52.6% and 52.6%, a total of 105.3%. Divided by the total they give 50% and 50%.

What our own data shows
We measured the margin on historical data. The source is the odds from football-data.co.uk for five leagues (Premier League, Bundesliga, La Liga, Serie A, Ligue 1), from the 2012/13 season to the current one, which is incomplete. The measurement is our own.
| Odds source (1X2) | Matches | Average margin |
|---|---|---|
| Pinnacle, closing | 24,383 | 2.44% |
| Market average, closing | 12,921 | 4.78% |
| Bet365, closing | 12,920 | 5.59% |
| Pinnacle, opening | 24,364 | 2.61% |
| Bet365, opening | 25,697 | 5.26% |
Pinnacle says on its support page that it runs a margin of around 2% against 6% for the industry. We find 2.4% for Pinnacle and 5.6% for Bet365 at the close. So they agree. The number of matches differs because football-data does not have every column for every season.

The second measurement is more interesting. We took Pinnacle’s closing odds, removed the margin with the proportional method and asked: when the market gives an outcome X%, how often does it happen?
| Market probability | Outcomes | Average probability | Actual frequency |
|---|---|---|---|
| 0-10% | 3,094 | 7.1% | 6.4% |
| 10-20% | 11,024 | 15.6% | 14.9% |
| 20-30% | 26,255 | 25.9% | 25.5% |
| 30-40% | 12,630 | 33.9% | 33.5% |
| 40-50% | 7,805 | 44.7% | 45.4% |
| 50-60% | 5,386 | 54.8% | 55.4% |
| 60-70% | 3,600 | 64.6% | 66.3% |
| 70-80% | 2,271 | 74.4% | 77.4% |
| 80-100% | 1,084 | 84.5% | 85.5% |
If odds were “right”, the last two columns would match. They nearly do. Pinnacle’s closing probabilities, once the margin is removed, are well calibrated. A small tendency shows: favourites win slightly more often than the price suggests and big outsiders slightly less often. In the literature this pattern is called the favourite-longshot bias. We draw no conclusion from it. We only measure that the difference is small.

How to use it
- Convert the odds: 1 ÷ odds.
- Remove the margin. If you have the prices of all outcomes, divide by the total.
- Compare with your own estimate. If you think a team wins 55% of the time and the market’s fair probability is 45%, there is a gap. The gap does not mean you are right.
- Do not forget the margin. For the price to be worth taking, your probability must exceed 1 ÷ odds, not the fair one. In our example, for the home win at 2.10 you need more than 47.6%.
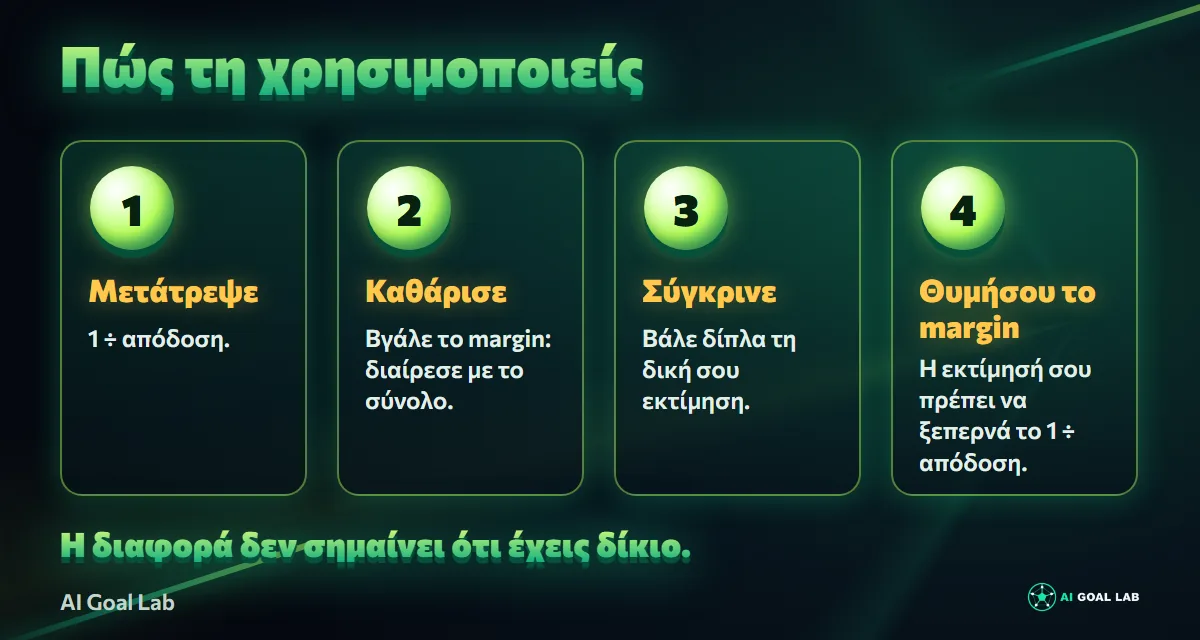
Do not say the market got it wrong just because your estimate differs. In our own backtest the closing market was more accurate than our model, which is why our live blend is 0.9 market and 0.1 model. Our model removes the margin with the power method and compares the result with the market.
Common mistakes
- Reading 2.00 as “likely”. Odds of 2.00 mean 50% plus margin, not “this is that likely”.
- Comparing bookmakers without margin. A bookmaker with a 6% margin and one with 2% show different prices for the same probability.
- Thinking probability is certainty. Even an 80% chance loses 1 time in 5.
Where you can see it on aigoallab.com
On the match pages of aigoallab.com you see probabilities for upcoming games next to the odds. In Analysis Studio you can open a match and compare the numbers yourself. They are reading tools and promise no profit.
Gamble responsibly. 21+. Only with money you can afford to lose.
FAQ
How do I calculate implied probability from decimal odds? Divide 1 by the odds. Odds of 2.50 give 1 ÷ 2.50 = 40%.
What is the overround? It is the sum of the implied probabilities of all outcomes minus 100%. It shows the bookmaker’s commission. In a 1X2 with a total of 104.8% the overround is 4.8%.
How much margin do bookmakers take on football? In our data for five leagues, Pinnacle had an average margin of 2.4% at the close and Bet365 5.6%. The number changes by bookmaker, market and moment.
Is implied probability the true probability? No. It includes the margin. After removing it, Pinnacle’s probabilities in our data were close to the real frequencies, but that is no certainty for any particular match.
Sources
- Wikipedia, Odds: https://en.wikipedia.org/wiki/Odds
- Pinnacle, Implied probability: https://www.pinnacle.com/en/esports-hub/betting-articles/educational/implied-probability-odds-conversion/72m2z3g3g22m5tps
- Pinnacle, How to calculate betting margins: https://www.pinnacle.com/en/esports-hub/betting-articles/strategy/how-to-calculate-betting-margins/w7824h9cm8d2vuj3
- Pinnacle Support, What is a betting margin: https://support.pinnacle.com/hc/en-us/articles/44854177573009-What-is-a-betting-margin
- Štrumbelj, E. (2014), On determining probability forecasts from betting odds, International Journal of Forecasting 30(4), 934-943: https://doi.org/10.1016/j.ijforecast.2014.02.008 (the paper’s details were confirmed on Crossref, but the original was not read)
- football-data.co.uk, historical odds: https://www.football-data.co.uk/data.php
- Our own margin and calibration measurement: internal file data/history (5 leagues, 2012/13 to 2026/27)
AI Goal Lab Team. Last updated: 10 November 2026. If you find a mistake, tell us and we will correct it.